
Introduction
This article was created for the capstone project publication of the Data Science bootcamp organized by Data Science Indonesia (DSI), the largest data science community in Indonesia. My team was given the opportunity to analyze disaster data from PetaBencana and flood data from BNPB.
This article discusses the insights obtained from the dataset provided by the Indonesian National Board for Disaster Management (BNPB).
Before diving into the main analysis, let's first become familiar with this institution.
About BNPB
The Indonesian National Board for Disaster Management (BNPB) is a Non-Ministerial Government Institution tasked with assisting the President of the Republic of Indonesia in disaster management in accordance with Law Number 24 of 2007 concerning Disaster Management. For more information, visit the official BNPB website.¹
What is Exploratory Data Analysis?
Exploratory Data Analysis (EDA) is a crucial step in every research analysis. The primary goal of exploratory analysis is to examine data for distributions, outliers, and anomalies to guide your specific hypothesis testing. It also provides tools for hypothesis generation by visualizing and understanding data, typically through graphical representations.²
Data Understanding
Before conducting EDA, we need to understand the dataset we're working with and identify what information can be extracted from the tabular data by examining the columns in the BNPB dataset.
The data provided by BNPB consists of flood incident reports collected from various regions across Indonesia during the period 2020–2021.

Dataset Columns and Descriptions
The BNPB dataset includes the following columns:
- Tanggal Kejadian (Incident Date): The date when the flood occurred
- Kejadian (Incidents): The number of flood incidents recorded
- Meninggal (Deaths): Number of fatalities
- Hilang (Missing): Number of missing persons
- Terluka (Injured): Number of injured persons
- Rumah Rusak (Damaged Houses): Number of residential structures damaged
- Fasum Rusak (Damaged Public Facilities): Number of public facilities damaged
Exploratory Data Analysis Findings
During the EDA phase, I focused on exploring flood incidents, their timeline, and their impact. The following columns were utilized:
- Tanggal Kejadian (Incident Date)
- Kejadian (Incidents)
- Meninggal (Deaths)
- Hilang (Missing)
- Terluka (Injured)
- Rumah Rusak (Damaged Houses)
- Fasum Rusak (Damaged Public Facilities)
During this analysis, I discovered several interesting insights, which are detailed in the sections below.
Finding 1: Floods Peak at the Beginning and End of the Year

Based on the timeline bar chart analysis, flood incidents show a seasonal pattern with peaks occurring at the beginning and end of each year. Notably, there was a decline in flood incidents at the start of 2021 compared to 2020; however, by year-end, the number of incidents exceeded the previous year, particularly in September, November, and December.
The largest increase occurred in November, with an 82% rise—from 125 incidents in 2020 to 228 incidents in 2021. Overall, flood incidents are more prevalent at the beginning and end of the calendar year across both years analyzed.
Finding 2: Damaged Houses and Injured Persons Represent the Greatest Impact

When examining the impacts of flood disasters, we can categorize them into two types:
- Human Impact (Casualties): Deaths, missing persons, and injured individuals
- Material Damage Impact: Damaged houses and public facilities
The analysis reveals that the most significant human impact was the number of injured persons, totaling 1,730 individuals. For material damage, the most significant impact was damaged houses, with 12,671 residential structures damaged.
Finding 3: Number of Flood Incidents Declined, but Their Impact Increased

Comparing the two-year period, the total number of flood incidents decreased by 15.5%, dropping from 1,609 incidents in 2020 to 1,359 incidents in 2021. However, this positive trend does not apply to the impacts caused by these floods.

Analysis shows that all impact metrics increased year-over-year. Human impact in 2021 tripled compared to 2020, while material damage doubled. This suggests that while floods have become less frequent, individual flood events have become significantly more severe and destructive.
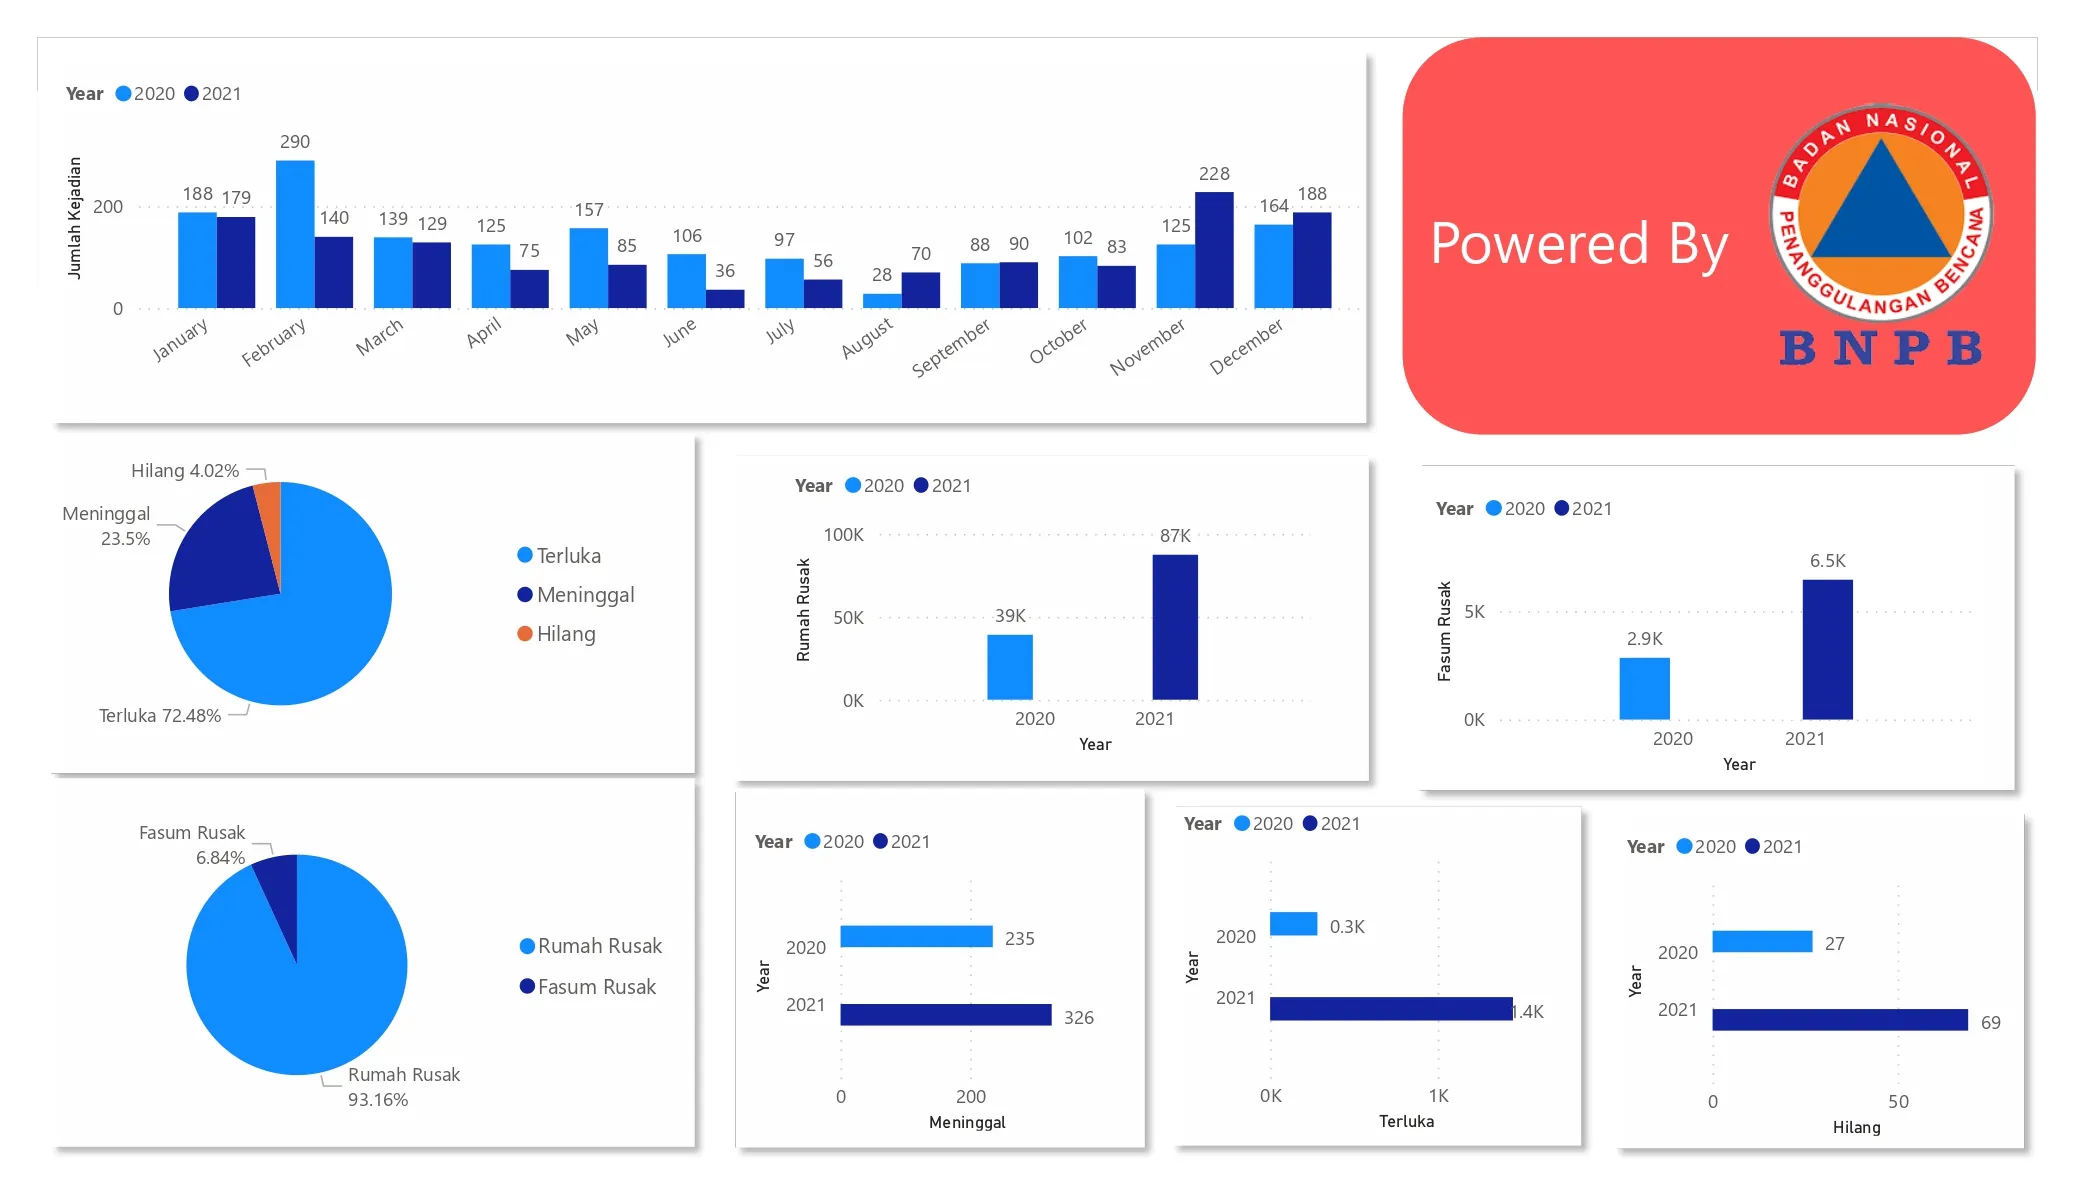
Dashboard
All visualizations created for this analysis are presented in a comprehensive dashboard developed using Power BI.

References
[1] https://en.wikipedia.org/wiki/Indonesian_National_Board_for_Disaster_Management
[2] Chong Ho, Yu. 2010. "Exploratory data analysis in the context of data mining and resampling". International Journal of Psychological Research. 3(1), 9–22.